Sphinx-Greenberg-Courses is a completely client-side web application designed to teach graduate students introduction to computer science. This course is taught at Stevens Institute of Technology under Professor Greenberg to over 50-100+ talented graduate students interested in Computer Science. The main goal for this website was to provide a template for other computer science courses to follow, meant to replace popular (but highly disliked) paid tools like ZyBooks. The client-side application is built off Static Site Generation, specifically using Sphinx, using WASM to build tools such as an interactive Python IDE to run test scripts and tools to build interactive quizzes for students to take!
HTML/CSS, JavaScript, Bootstrap, Python, Git, GitHub, GitHub Pages, Sphinx, Web Development
View ProjectA Python financial/quantitative statistics bot designed to give discord users near unlimited access to key financial data and statistical models to view. Features include:
Python, Quantitative Statistics, Pandas, Data Analysis, Numpy, Yahoo Finance, Google Finance, Matplotlib, Plotly
View ProjectThis project is currently in progress and production build has not been released. But this will be one of my most impressive (and ambitious) projects so far. Stockodash is a full stack Plotly-Dash/Django web application designed to give users an accurate analysis of their financial portfolio. Similar to Morningstar's porfolio XRay, except this will be free and open-source to all! No longer will you need to use a complex paid subscription service when all you have to do is login to mine, input your porfolio data, and see the same statistics any paid tool will give you!
Python, Django, SQL, Portfolio Analysis, Statistics, Machine Learning, PyTorch, HTML/CSS, JavaScript, Web Development
View Project (Not finished!)Burning Glass Analysis was the key quantitative analysis for my research project for my Undergraduate Research internship for the summer! The main objective for my summer research was to analyze the growth of data science skills in the US job market using data from 2007 to 2021. This is actually part 2 of my overall research, my previous analysis utilized ONET's job task's and analyze the growth of task categories among U.S. jobs. However Burning Glass is a much more accurate and comprehensive dataset, and therefore I was able to analyze the true growth of data science skills in the U.S. job market. This project was done in collaboration with Dr. Jeffery Nickerson of Stevens Institute of Technology and research on Generative AI and growth of AI in general. I in terms of size of of data I was able to query about 26 million rows of job advertisements and skill data using PostGreSQL and provided my full analysis of it in an extremely long Jupyter Notebook. After my internship was over I submitted my research to Dr. Nickerson with the goal of looking into the analysis and growth of Machine Learning skills in the U.S. job market.
Python, Pandas, Data Analysis, PostgreSQL, Jupyter Notebook, Data Visualization, Matplotlib, Plotly, Seaborn, Scipy, Numpy
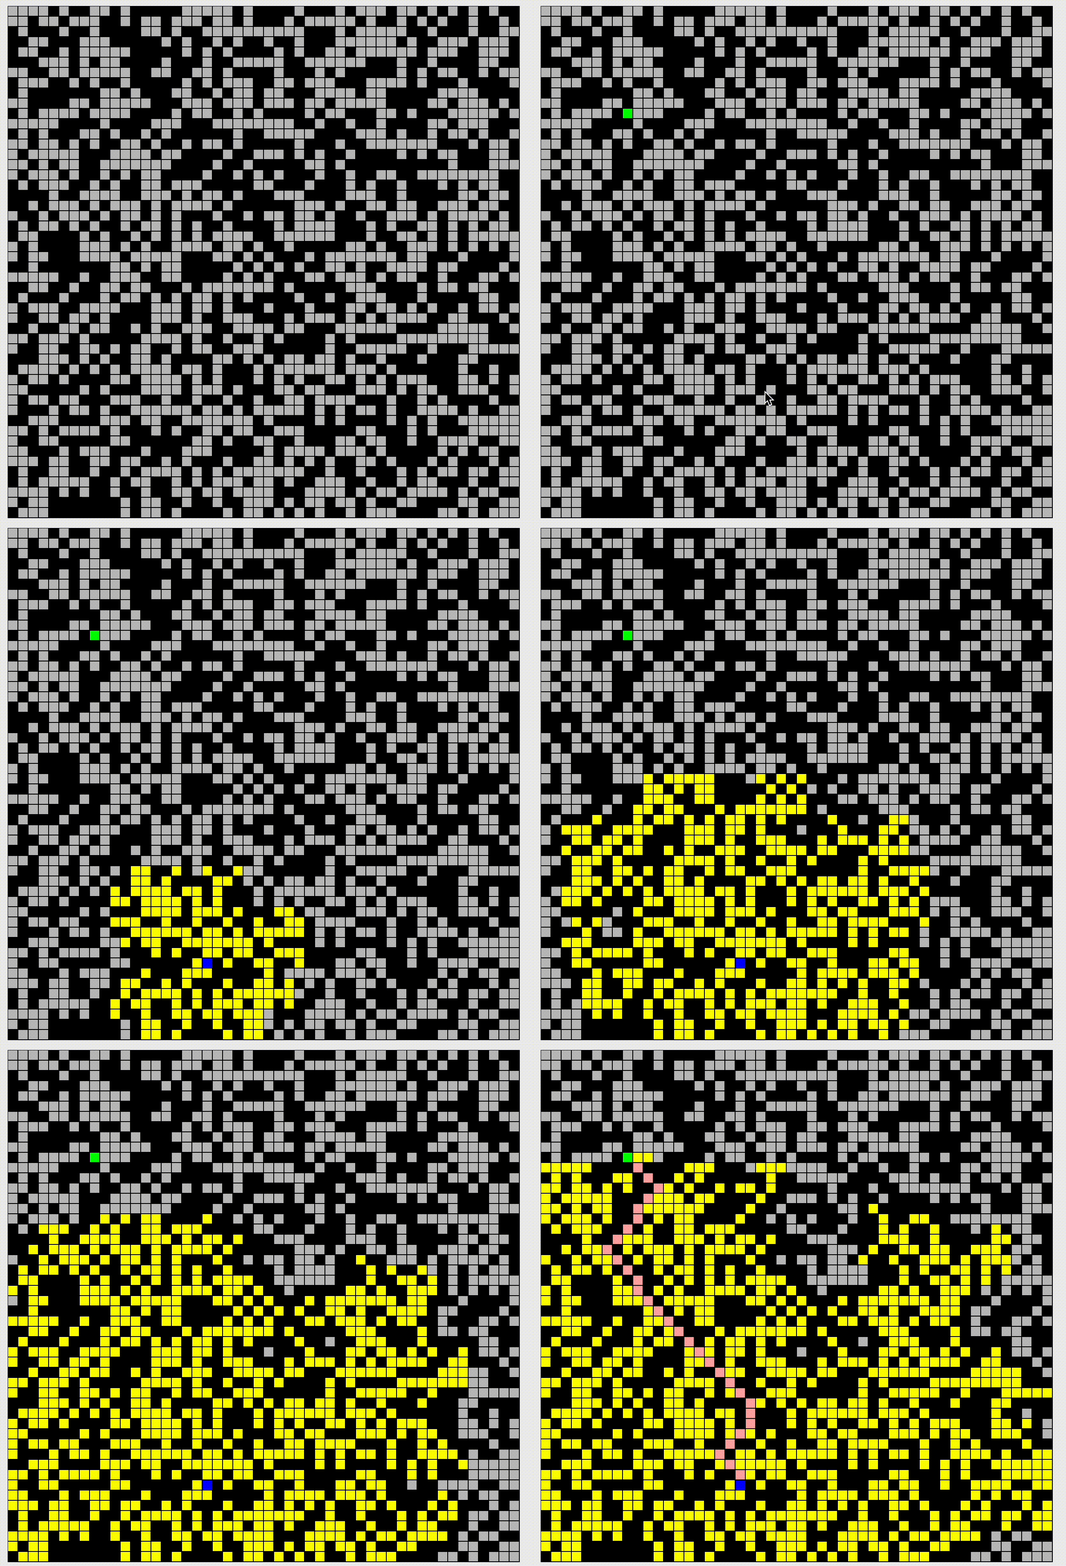
View ProjectA Java Swing and Java AWT application designed to give a full visualization of both the popular A-Star and Dijkstra pathfinding algorithms. The application allows the user to create their own maze and then run the algorithm to find the shortest path from the start to the end. The application also allows the user to change the speed of the algorithm and the size of the grid. This is the first project that got me into visualzing algorithms and I am very proud of it! This would later motivate me to create both my 2D Cellular Automata Visualizer and my Sorting Algorithm Visualizer Projects!
Java, Java AWT, Java Swing, Data Structures and Algorithms, Visualzation, GUI Development

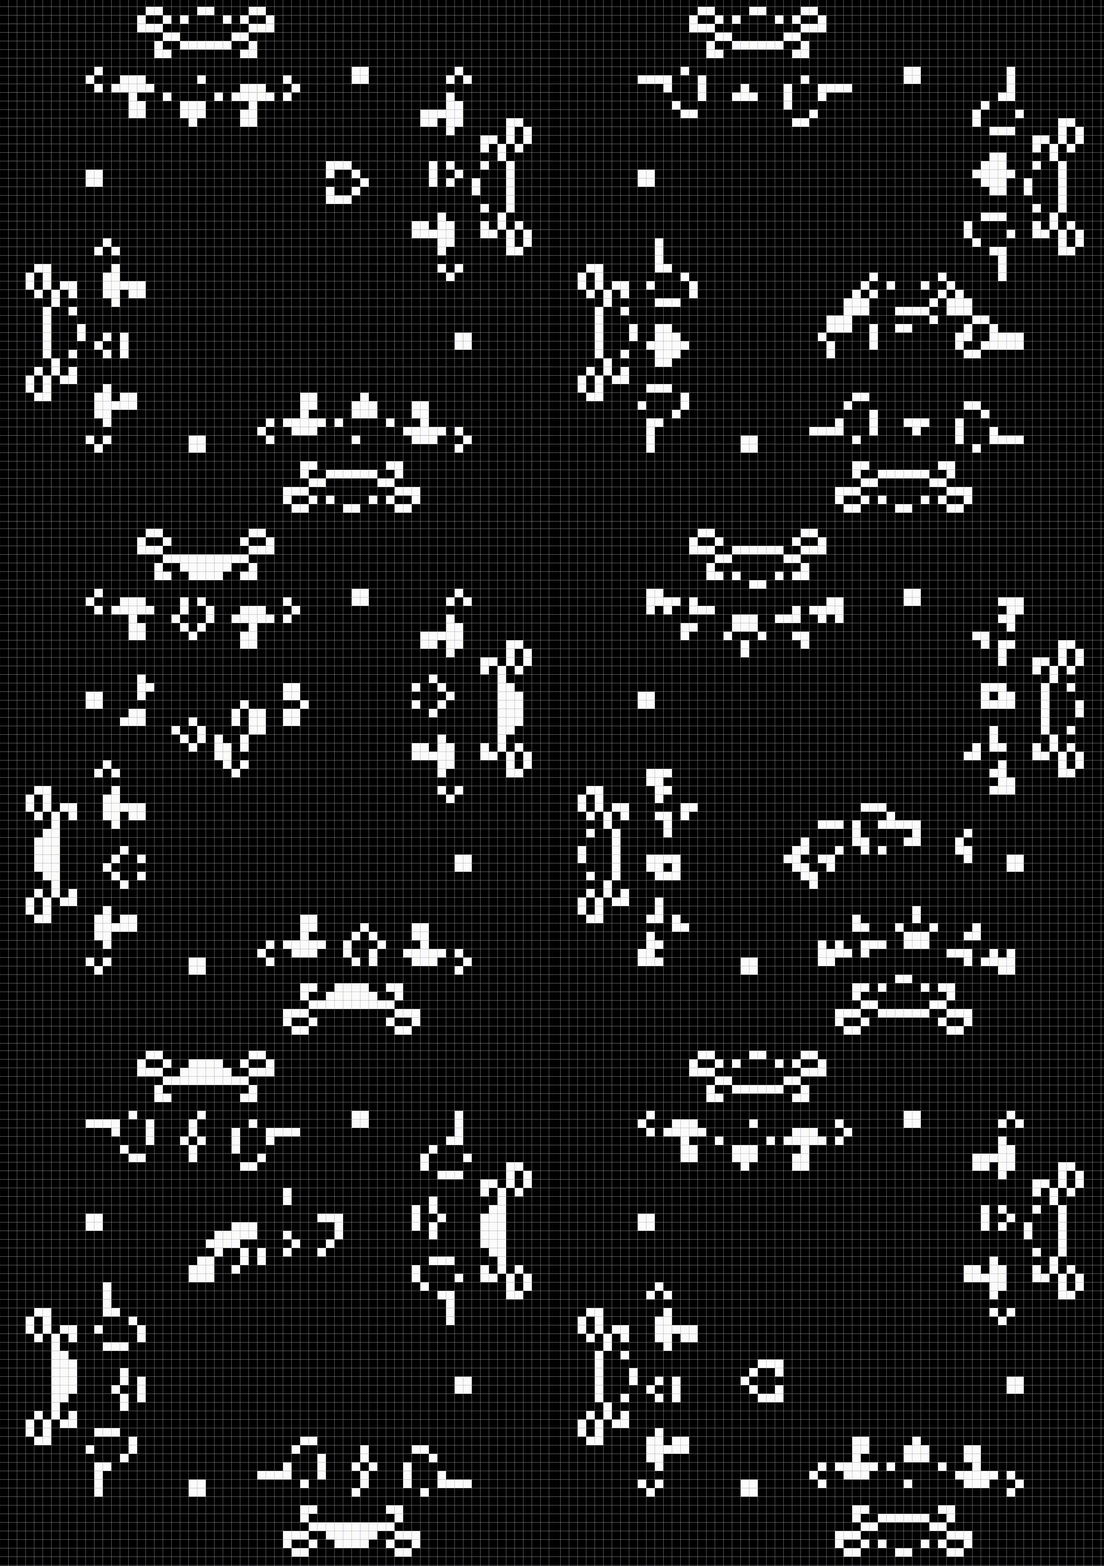
A C++ SFML application designed to give a full visualization of 2D Cellular Automata. The application allows the user to create their own 2D Cellular Automata and then run the simulation to see the results. The application also allows the user to change the speed of the simulation and the size of the grid. This project was inspired by my A-Star and Dijkstra Algorithm Visualizer and I wanted to create a similar project, it also helped me learn C++ and SFML! Additionally you can create your own patterns to simulate and see the results!
C/C++, SFML, Cellular Automata, Data Structures and Algorithms, Visualzation, GUI Development, Conways Game of Life
